
May 2025 Flagstaff Market Report: What Buyers and Sellers Should Know Right Now
Hey there, Buyers and Sellers! Let's dive into some key real estate metrics that can give us valuable insights into the current market trends.
Your May Flagstaff Market Update
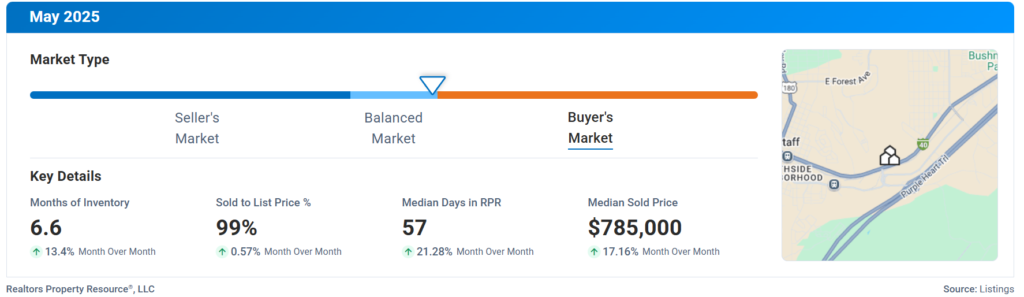
First up, we have the Months Supply of Inventory, which is at 6.6. This number tells us how long it would take for all the current listings to sell at the current sales pace. A lower number typically indicates a seller's market, while a higher number suggests a buyer's market.
Next, we have the 12-Month Change in Months of Inventory, which is at 1.01%. This percentage change gives us an idea of how the inventory levels have fluctuated over the past year. A positive change could indicate increasing inventory, while a negative change might suggest decreasing inventory.
Moving on to the Median Days Homes are On the Market, which is at 57. This metric tells us how long, on average, it takes for a home to sell once it's listed. A lower number indicates a faster-moving market, while a higher number suggests a slower market.
The Sold to List Price Percentage is at 0.99%, which means that, on average, homes are selling for 99% of their list price. This can give us an indication of how competitive the market is and how much negotiating power buyers and sellers may have.
Lastly, we have the Median Sold Price, which is at $785,000. This is the middle point of all the sold prices, meaning half of the homes sold for more and half sold for less. This number can give us an idea of the overall price trends in the market.
What It Means For You
By looking at these metrics together, we can get a comprehensive picture of the current real estate landscape. Whether you're looking to buy or sell, understanding these key indicators can help you make informed decisions and navigate the market with confidence. Happy house hunting!
-
Let’s make your real estate dreams a reality—whether you’re moving in or moving on, I’m here to guide you every step of the way. Call me, I answer my phone.